My Role
Interaction Design, Backend Programming, Architecture and UI Design
Tools
Figma, ReactJS, FastAPI (Python), Tailwind CSS, Azure, GitHub, GPT API, LinkedIn API
This project began with ACE (Arctic Center of Energy), who had a vision: to automatically collect and continuously update visualizations of their local and international ecosystem. Their goal was to support regional development and the electrification shift that Skellefteå is at the center of, by giving actors in the region the ability to see connections, collaborations, and opportunities at a glance.
With support from Sammes Stiftelse, we - two design engineering students - worked closely together to take that vision and transform it into a prototype tool we call LINA (Local Intelligence & Network Analysis - working title).
Our challenge was to design something that could bring the power of business intelligence to smaller actors – municipalities, research groups, local businesses who don’t have access to tools like SAP or PowerBI. We asked ourselves: what if ecosystem analysis could feel as simple as zooming in on Google Maps?
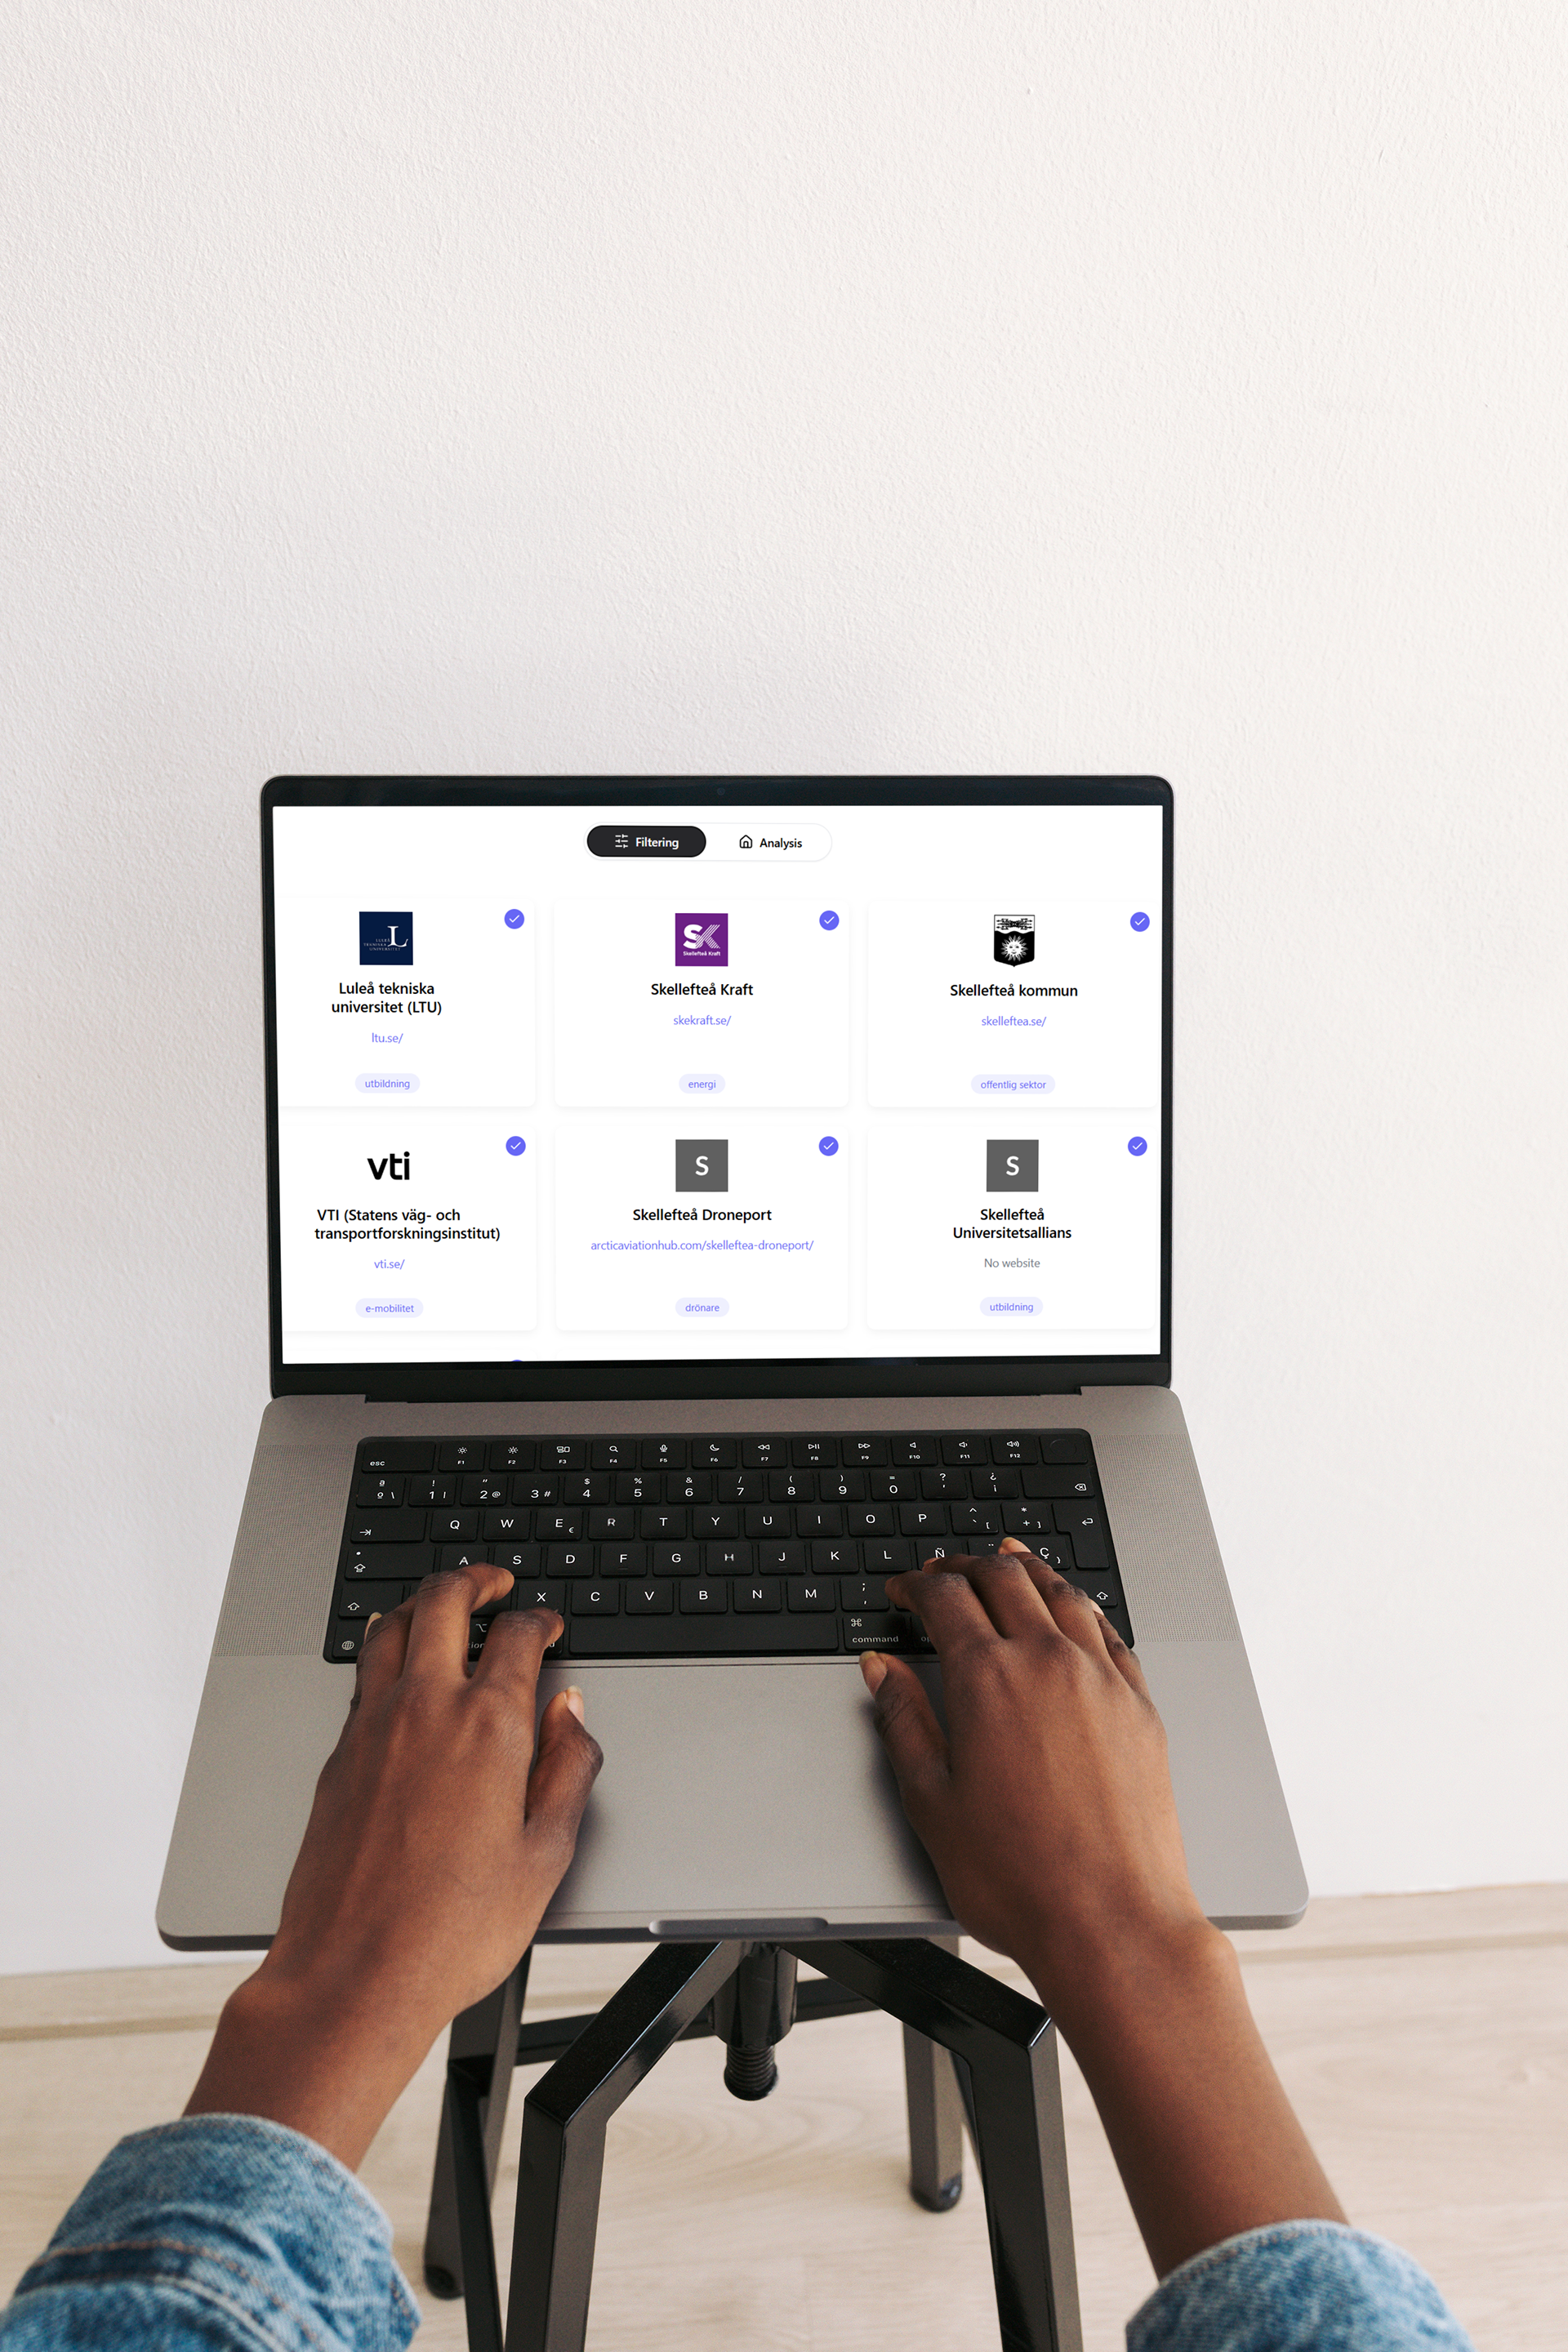
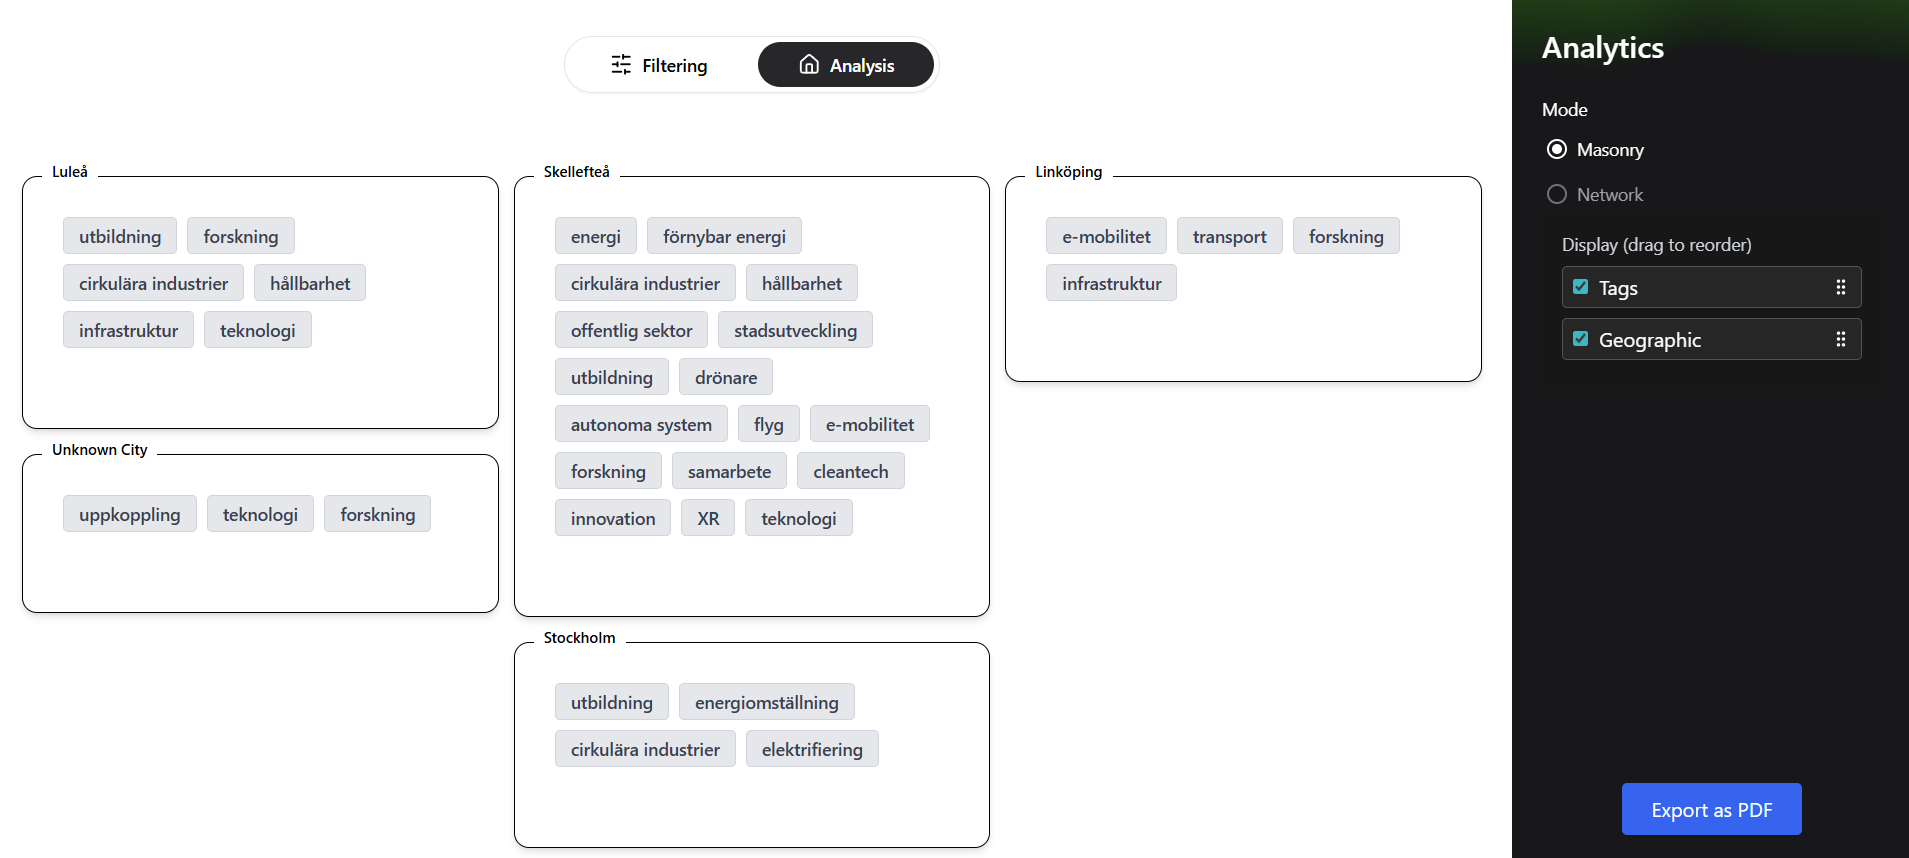
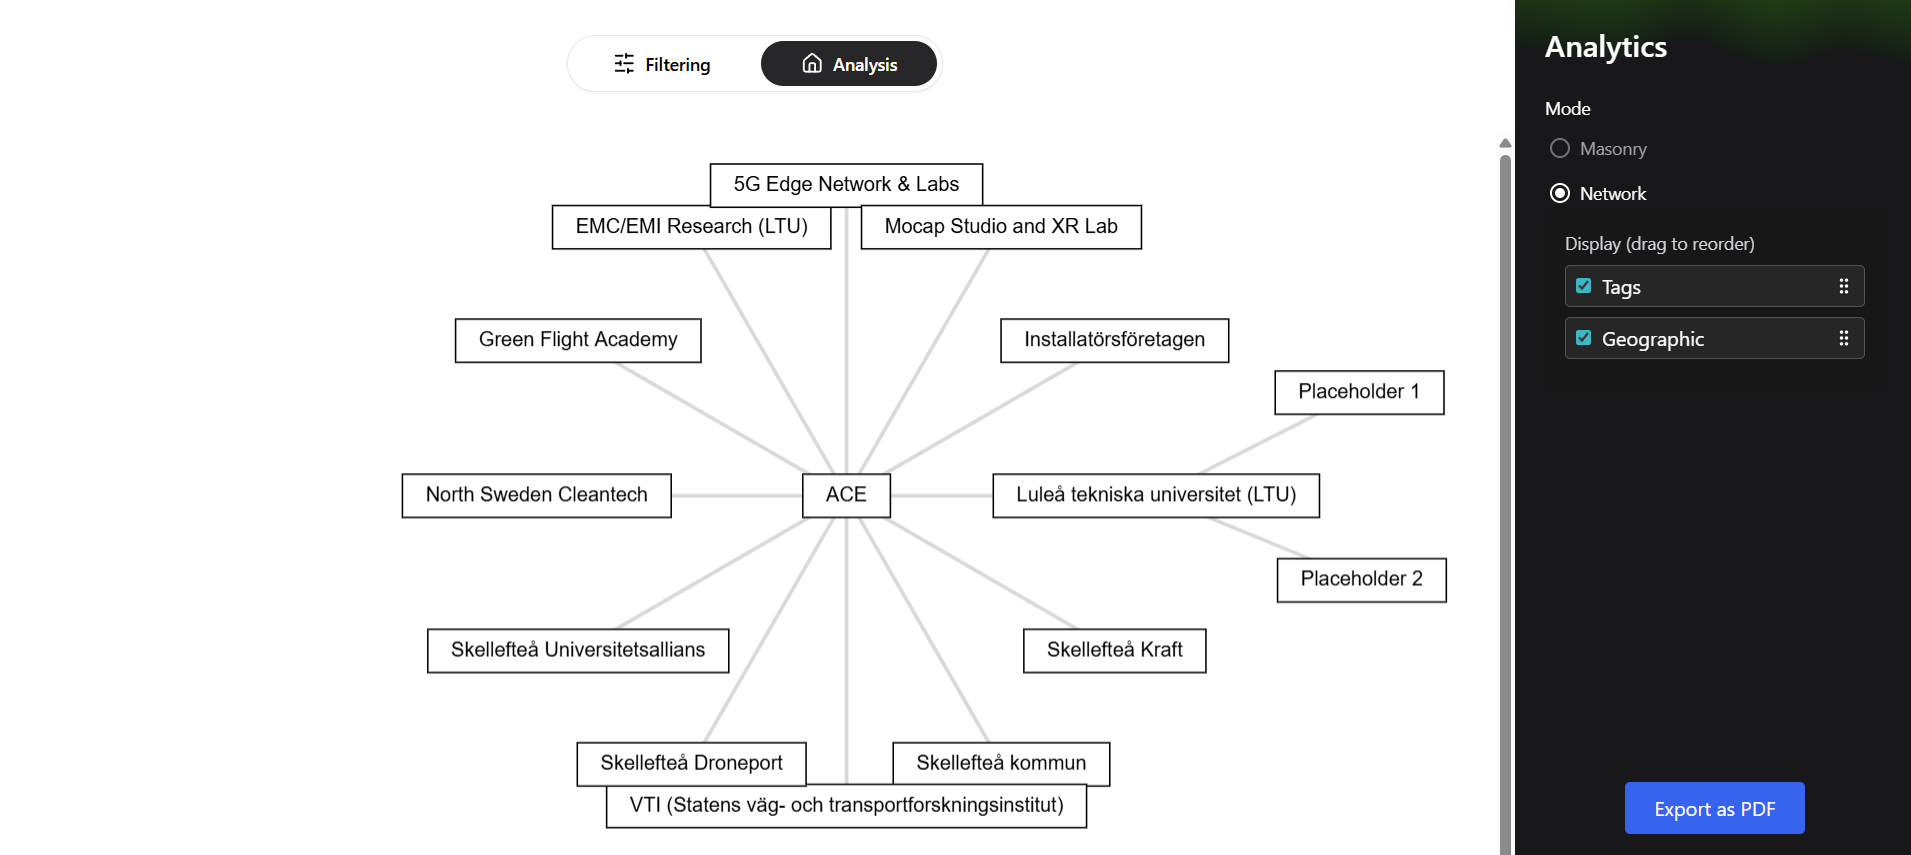
As a team, we combined interaction design and system prototyping. We mapped user needs, information structures, and designed flows that could guide non-specialist users from raw data to meaningful insights. In Figma, we built mockups and interactive prototypes that visualized how companies, projects, and sectors could be mapped in intuitive ways.
At the same time, we wanted to test the technical side. We collaboratively developed a backend prototype in FastAPI hosted on Azure, capable of fetching data from multiple sources, applying AI-based tagging, and preparing it for visualization. On the front end, we experimented with ReactJS and Tailwind to test how interactive visual maps could feel simple and lightweight for end users.
The result was LINA: a prototype that can collect, refine, and visualize data, giving ACE a foundation for automated, contextualized analysis of their ecosystem. With LINA, a municipality could instantly see which companies are working with hydrogen, or a research team could identify potential industrial partners – insights that previously required expensive systems or manual research.
For ACE, this was more than a visualization: it was a first step toward making regional intelligence accessible, automated, and locally relevant. For us, it was an opportunity to merge design thinking, teamwork, and hands-on development, building not just a vision, but a working proof of concept.